The Brief:
Using data which was provided to us, we were asked to find a creative and visually engaging way to show that BP gives a lot back to the UK.
What We Did:
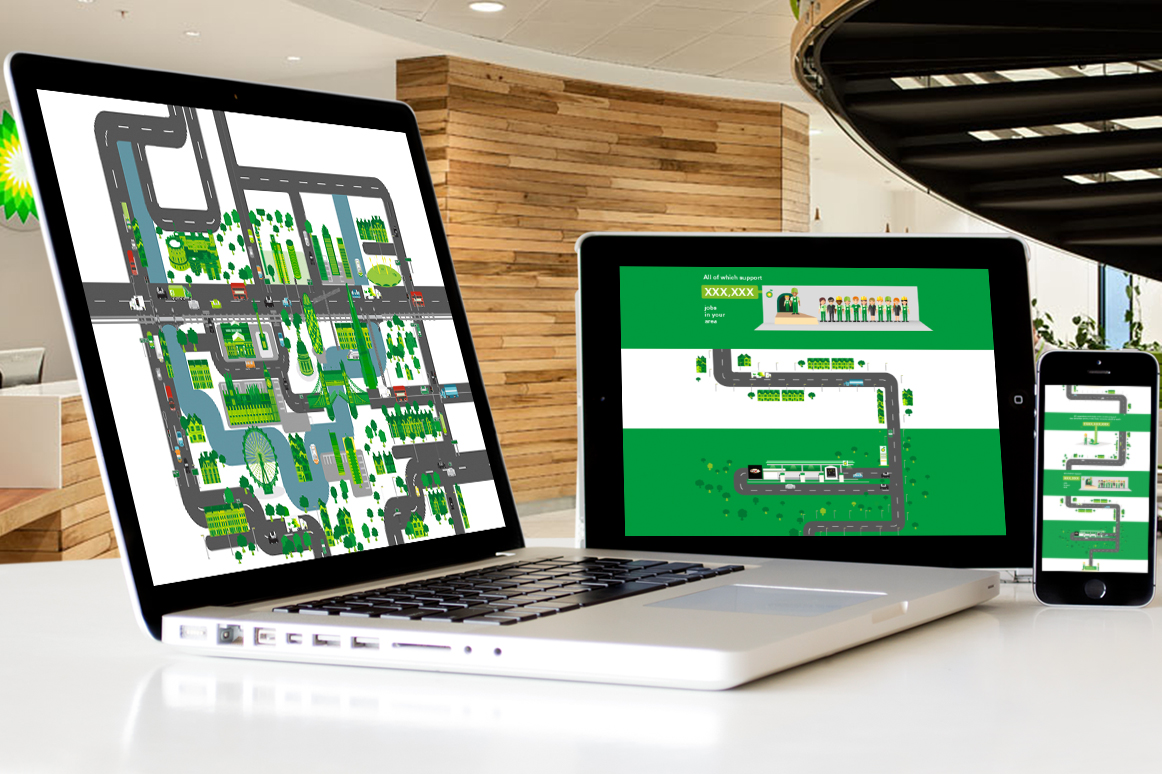
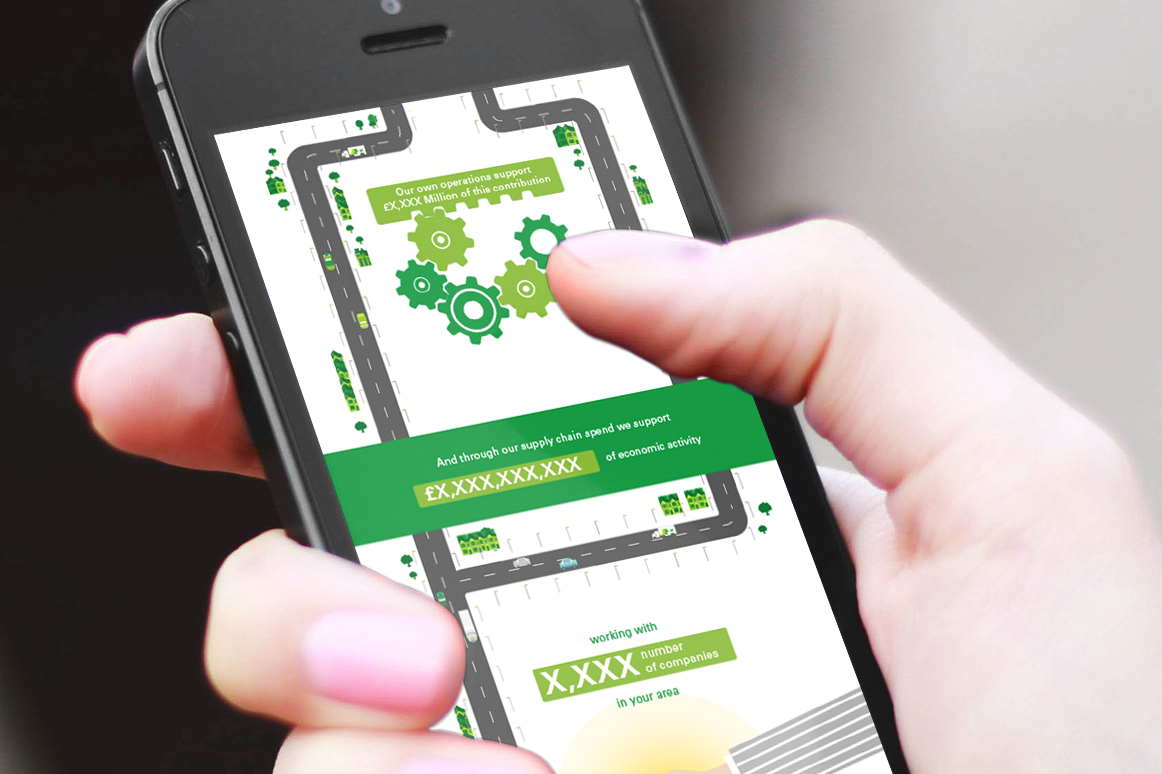
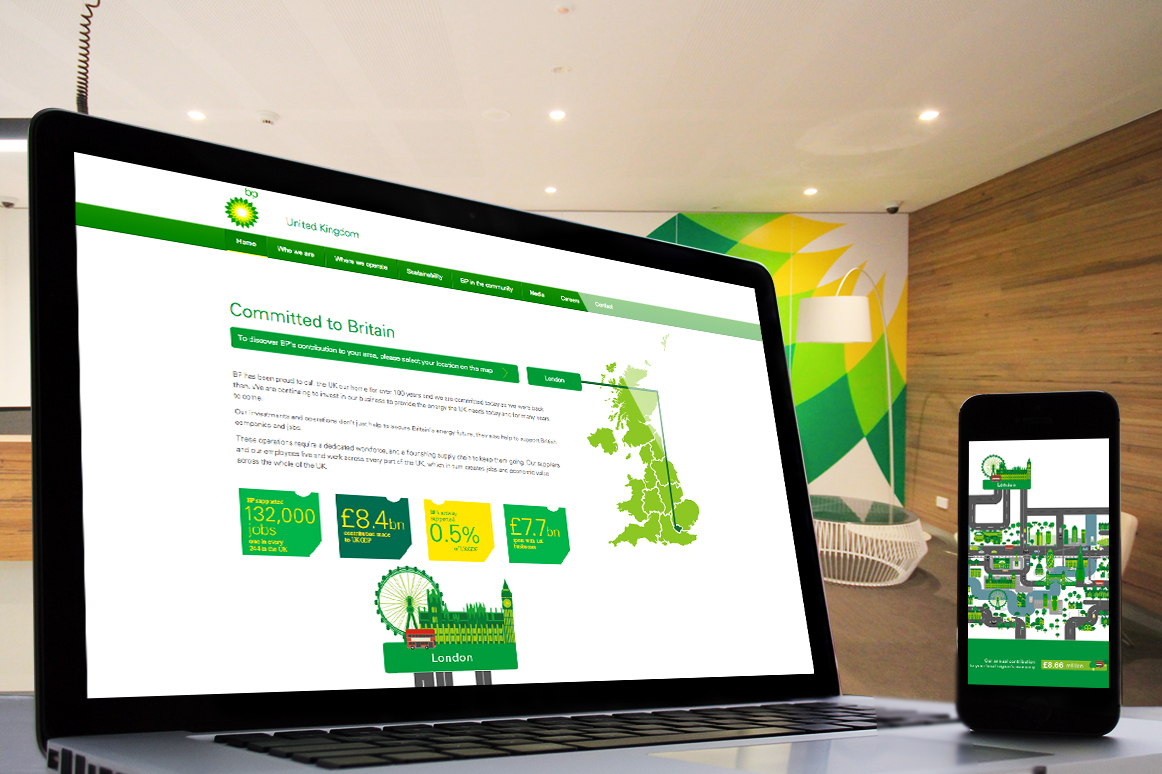
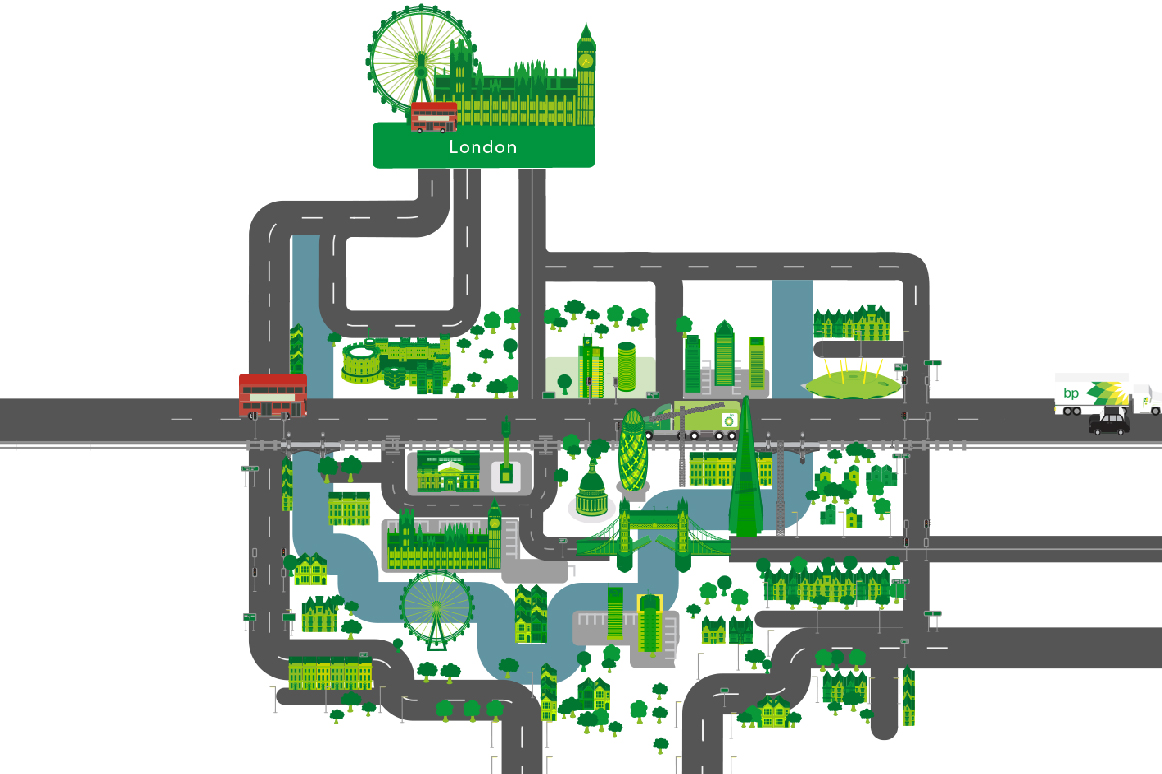
We developed an interactive infographic website showing visitors animated content, key facts and figures showing the contribution BP has made to your area over the last 100 years.
After simply selecting selecting a region within the UK, and as you scroll down the infographic, different data sets are revealed amongst little animated finesses to give the whole piece a richer feel. We encouraged users to share on key social media channels.
The website stayed visually 'on brand' and can be viewed on BP’s Global website.

